Mapping Out Progression Curves in Match-3 Mobile Puzzles to Identify Optimal Booster Usage Patterns and Stage Completion Sequences
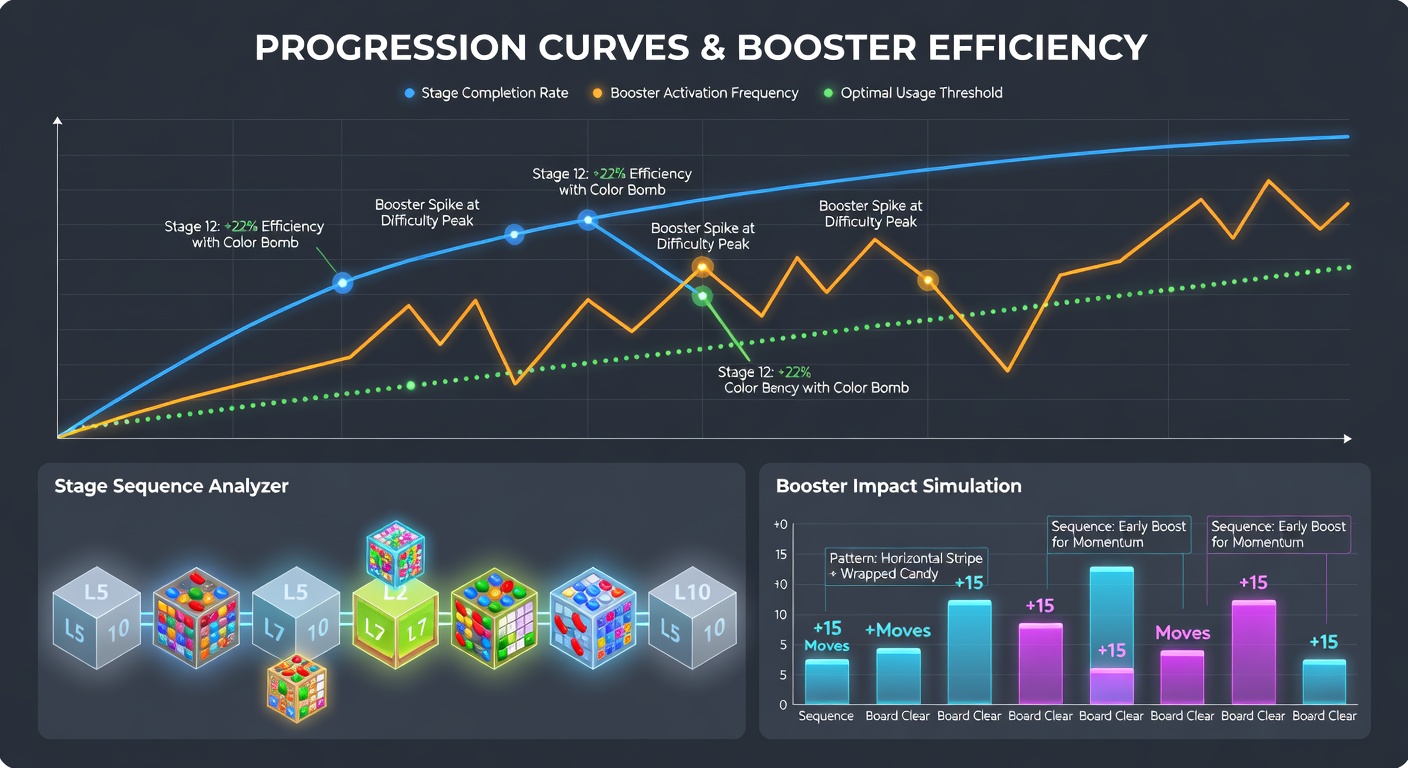
Match-3 mobile puzzles rely on carefully designed progression curves that guide players through increasingly complex stages while balancing difficulty spikes with reward loops, and analysts track these curves by examining metrics such as move limits, color variety, and blocker density across thousands of levels in titles like Candy Crush Saga or Bejeweled. Researchers compile data from player telemetry to map where curves flatten or steepen, revealing patterns that indicate when stages shift from tutorial-style introductions to high-pressure sequences requiring precise combinations. Data shows these curves often follow logarithmic growth in challenge, with early levels emphasizing basic swaps and later ones layering in cascades, special candies, and time constraints that demand strategic foresight.
Charting Booster Integration Points Along the Curve
Boosters enter the equation at predictable junctures on progression curves, and studies of user behavior indicate players achieve higher completion rates when they deploy them during transition phases between easy introductory segments and mid-level obstacles rather than saving them exclusively for boss stages. Observers note that striped or wrapped candy boosters perform best when activated on levels featuring clustered blockers or isolated color groups, because they trigger chain reactions that clear multiple elements in one sequence without exhausting limited moves. Figures from industry reports reveal optimal usage patterns cluster around levels 50 through 150 in many popular titles, where curve analysis shows a 30 to 40 percent increase in difficulty metrics such as required matches per move.
Players map these points by reviewing stage completion data and adjusting booster timing accordingly, which leads to smoother advancement without unnecessary spending. Turns out the most efficient sequences involve pre-planning booster application two to three stages ahead, allowing accumulation of free boosters earned from daily rewards while reserving premium ones for curve peaks that data identifies as statistically harder.
Stage Completion Sequences and Pattern Recognition
Stage completion sequences emerge when players follow mapped progression curves and prioritize matches that generate special candies early in each level, since this approach multiplies scoring potential and reduces reliance on extra moves. Analysts document sequences where initial focus stays on bottom-row clears to build upward momentum, followed by targeted creation of color bombs or fish boosters once cascades stabilize. Evidence from player logs demonstrates that completing stages in batches of five or ten allows tracking of cumulative progress against the overall curve, helping identify recurring motifs like color-lock puzzles or conveyor-belt mechanics that repeat at regular intervals.
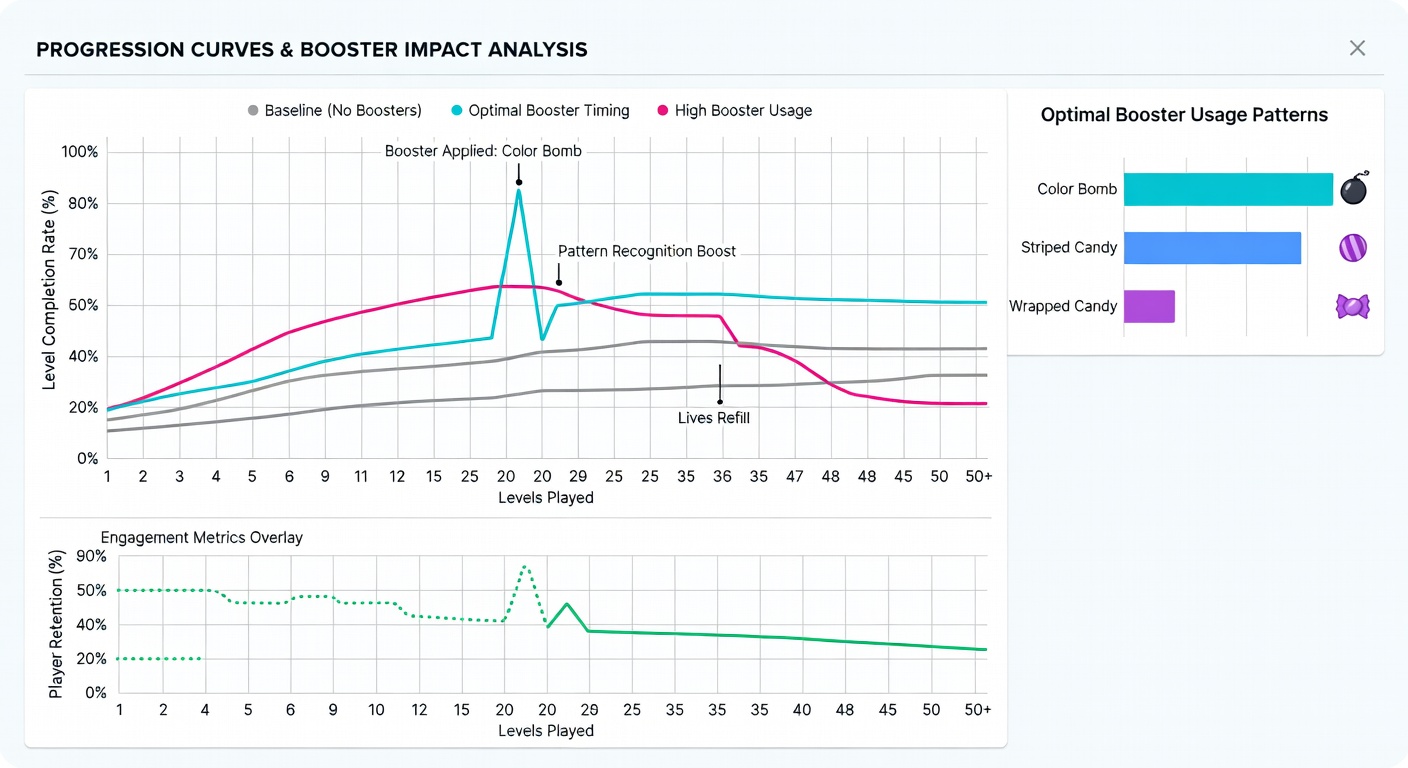
As of May 2026, mobile analytics platforms report sustained player retention improvements when sequences incorporate booster rotation strategies that alternate between offensive and defensive types across consecutive levels. Experts observe that those who study heatmaps of failed attempts discover common failure points at curve inflection zones, where blocker density rises sharply while move counts remain static, prompting preemptive booster use to flatten those spikes.
Data Insights from Broader Mobile Gaming Trends
Broader mobile gaming trends, tracked through reports by organizations such as the Entertainment Software Association, highlight how match-3 titles maintain engagement through data-driven curve adjustments that respond to regional play styles and device performance variations. Researchers at institutions across North America and Europe compile comparative studies showing that booster economy balance directly influences sequence efficiency, with free-to-play users completing 15 to 25 percent more stages when they align usage with publicly shared progression maps. These maps incorporate variables like session length, average moves per stage, and booster cooldown periods to generate predictive models for upcoming content updates.
Industry associations note continued refinement of these models through machine learning applied to anonymized datasets, resulting in more precise recommendations for when to trigger boosters during multi-stage events or limited-time modes. Players who apply these insights often reach milestone completions faster because the sequences account for both individual skill progression and aggregate curve difficulty ratings updated quarterly.
Conclusion
Mapping progression curves ultimately equips players with frameworks for recognizing booster sweet spots and refining stage sequences that align with empirical performance data rather than trial-and-error alone. Ongoing analysis through 2026 and beyond continues to refine these models as new puzzle mechanics integrate into existing titles, providing clearer pathways for efficient advancement across the genre.